Alerts Center
The Alerts Center offers an advanced diagnostic interface for managing consumption anomalies in real time. It is structured around three key axes:
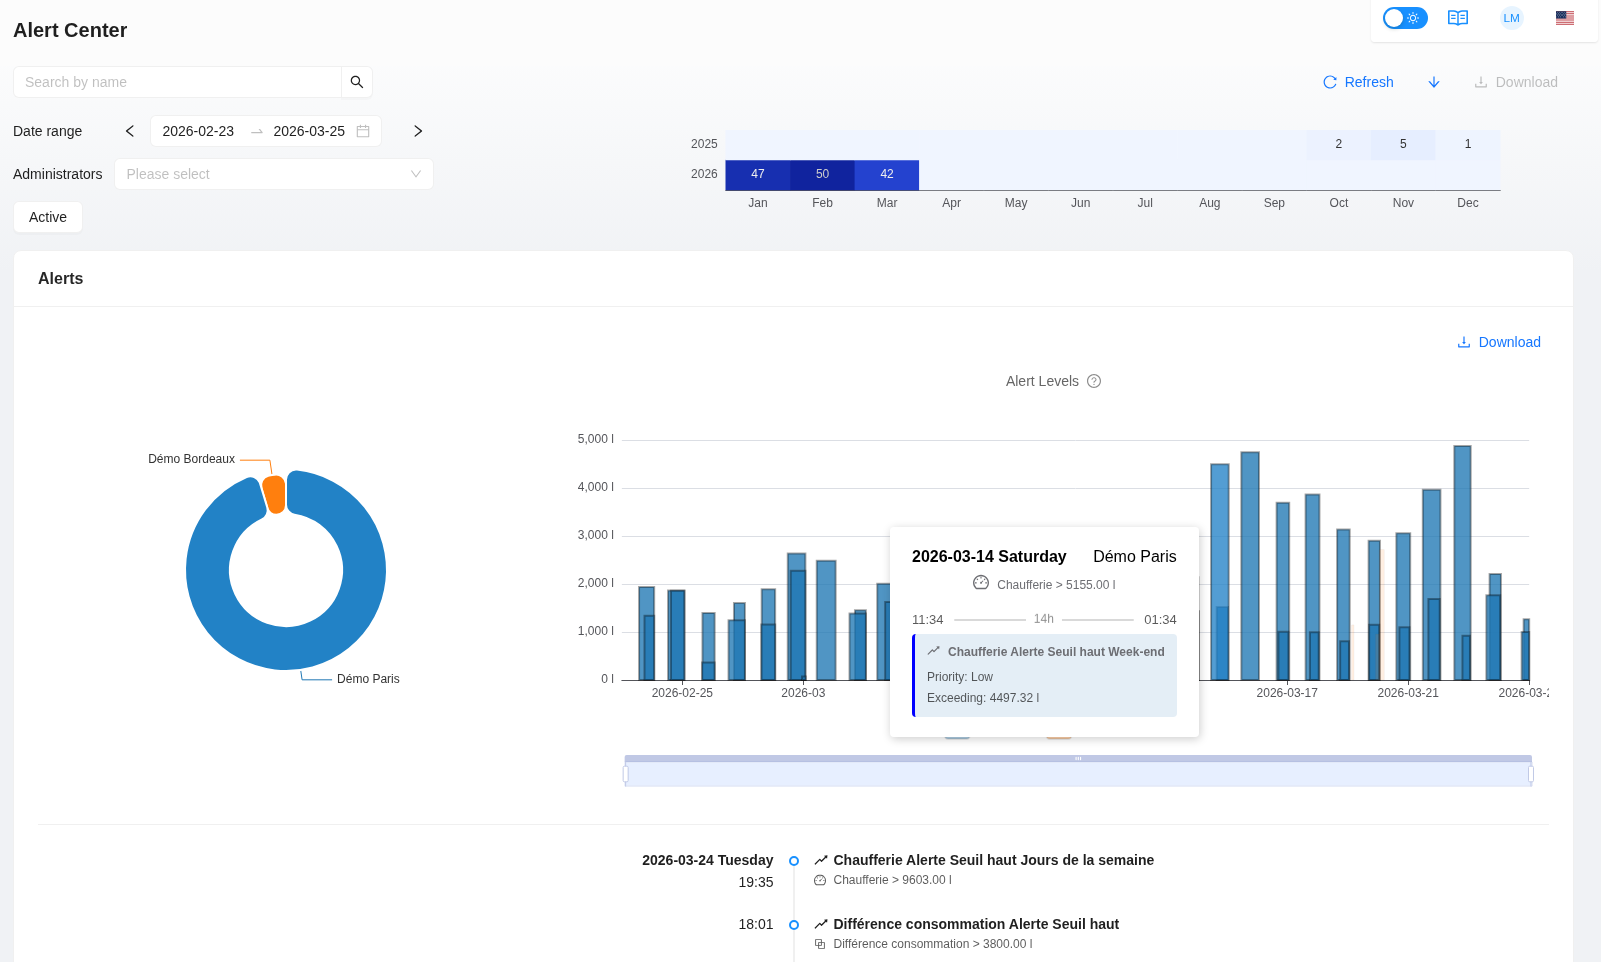
Distribution Analysis (Donut Chart)
This chart identifies the most critical sites by isolating their contribution to the total excess volume.
Usage: Prioritize interventions on sites generating the largest volumes of losses.
Time and Intensity Analysis (Histogram)
The graphical history measures the duration and amplitude (in liters) of each over-consumption peak.
Usage: Distinguish a continuous leak from a one-time exceptional consumption peak.
Interactivity: Hovering over a peak displays the precise details of the exceedance (threshold crossed, exact duration, priority).
Event Log and Actions
Located below the charts, this feed lists detected alerts chronologically.
-
Operational Tracking: Each event can be marked as "read" or be the subject of internal comments to ensure traceability of technical diagnostics.
-
Filtering: Ability to filter by period, site, or administrator for a targeted audit.
-
Severity Indicator: Each alert is now qualified according to its flow rate ($l/min$) to assess the urgency of intervention. The system ranks events in four levels: Micro-leak, Low leak, Major leak, or Critical emergency.