Dashboard
The dashboard provides a direct view of managed sites and ongoing events.
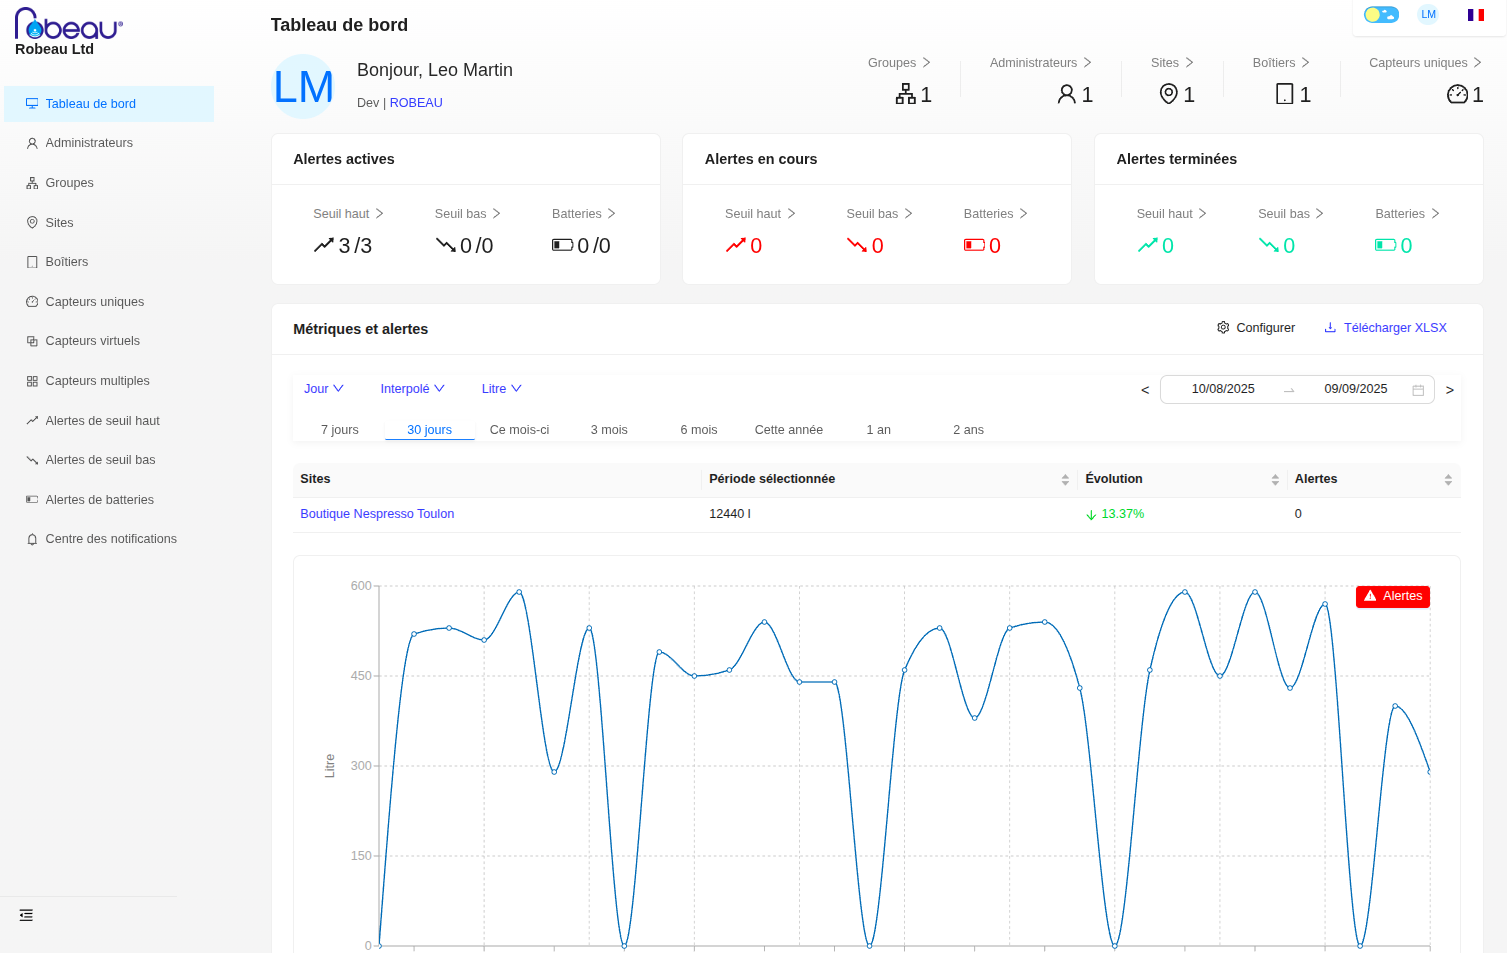
Indicator Visualization Bar
The visualization bar allows you to see your key indicators related to your ROBEAU account. It is clickable and allows you to go directly to the tab for each indicator.
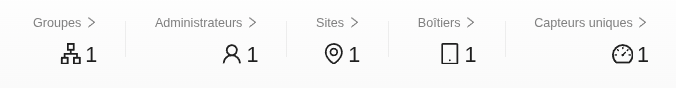
- Groups: The number of managed groups.
- Administrators: The number of registered administrators.
- Sites: The number of covered sites.
- Devices: The number of devices (transmitters) present.
- Unique Sensors: The number of installed sensors (meters).
Alert Visualization Bar
This section allows you to view all types of alerts: active, ongoing, and completed.
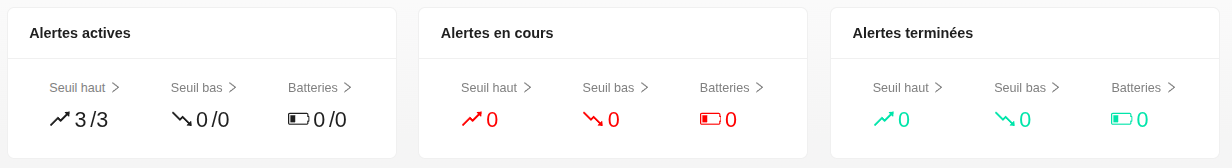
- Active Alerts: Alerts currently issued by the platform that require immediate action.
- Ongoing Alerts: Alerts that have been reported and are being processed, but are not yet resolved.
- Completed Alerts: Alerts that have been fully resolved.
For each cycle, the following categories are distinguished:
- High Threshold: Indicates over-consumption (waste, leak) where a threshold has been exceeded.
- Low Threshold: Indicates that an insufficient amount of water has been consumed.
- Batteries: Alerts related to the battery level of the device/transmitter.
Metrics and Alerts
This section displays detailed consumption curves for each site under your management. It allows you to analyze water consumption trends and quickly identify anomalies.
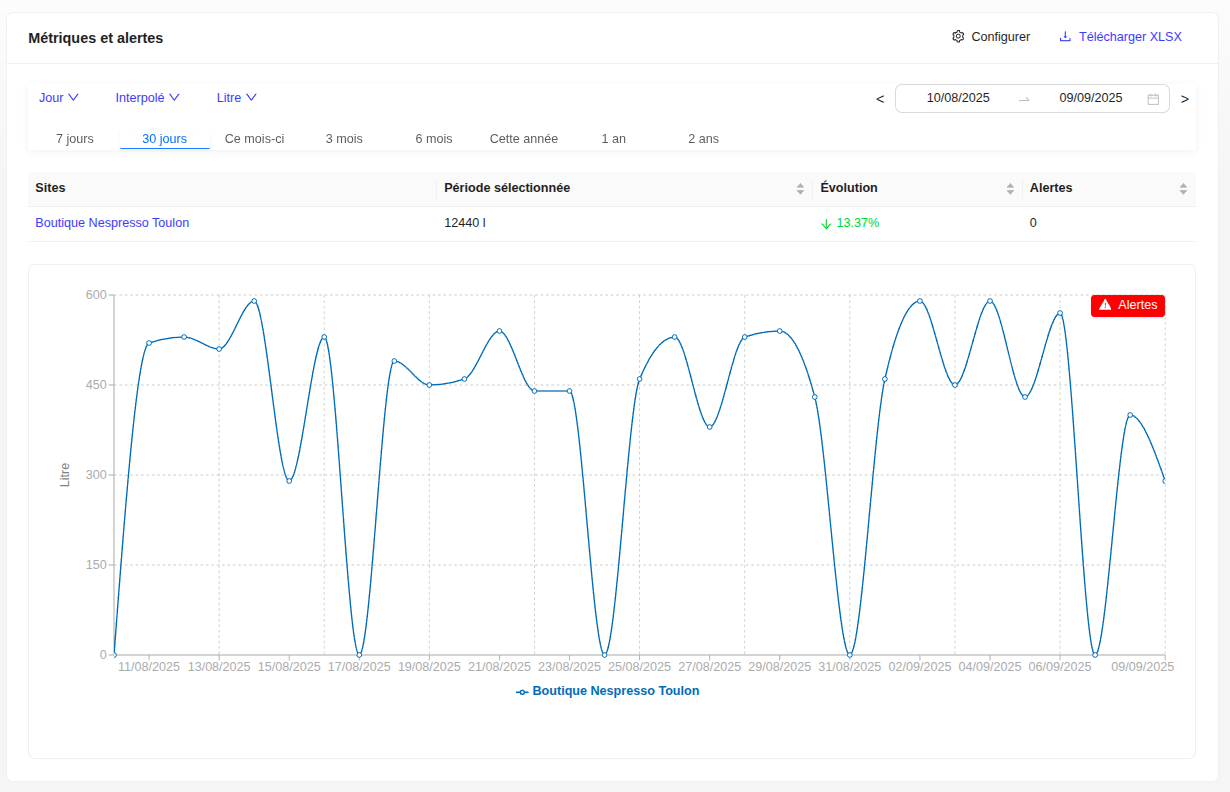
- Graphical Visualization: Real-time consumption curves showing the evolution of water thresholds per site.
- Period Selection: Time filtering to analyze data over different ranges (day, week, month, year).
- Site Comparison: Ability to compare consumption performance between different sites.
- Performance Indicators: Display of the percentage change compared to the previous period.
- Anomaly Detection: Automatic highlighting of consumption peaks and abnormal activity periods.
- Data Export: Functionality to download metrics in XLSX format for in-depth analysis.
Information Displayed:
- Selected Period: Total threshold consumed over the chosen period.
- Evolution: Percentage of increase or decrease compared to the previous period.
- Number of Alerts: Counter of alerts generated for each site.
- Interactive Graph: Detailed curve with clickable data points for precise information.
This view provides a global and detailed vision of your sites' water consumption, facilitating decision-making and early problem detection.
Alerts Center
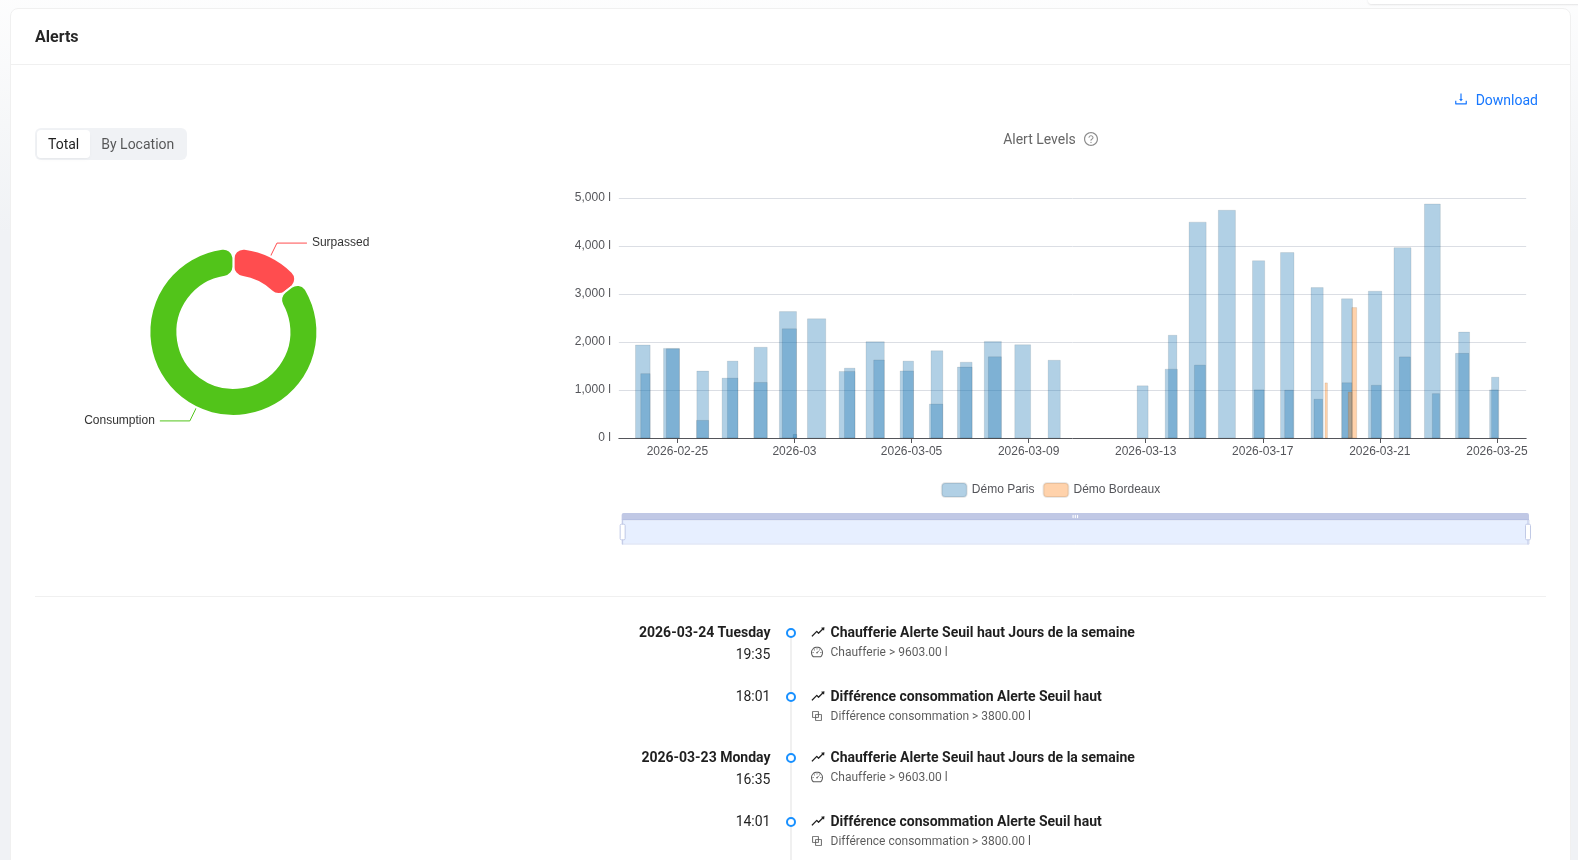
This module centralizes consumption data exceeding configured limits and the real-time event history. It offers a diagnostic interface structured around three axes:
-
Volume Distribution: A chart identifies the most critical sites by isolating their contribution to the total excess volume.
-
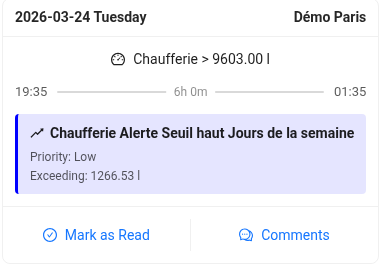
Time Analysis: A histogram measures the duration and amplitude (in liters) of each over-consumption peak. Hovering over a peak displays the precise details of the exceedance (threshold crossed, exact duration, priority).
-
Event Log: Located below the charts, this feed lists detected alerts chronologically. You can follow an alert, mark it as "seen", or add internal comments.
The Alerts Center is accessible from the main menu.