Additional Features
Here are some cross-functional features available on the platform.
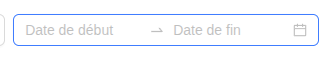
Custom Time Range
In most views, you can select a custom date range to refine your analysis.
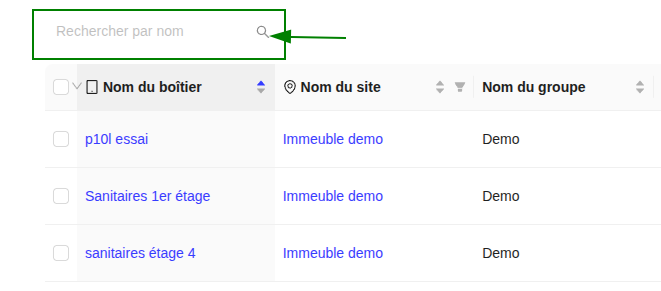
Search Option
Use the "Search by name" search bar to quickly find an item in the lists (administrator, site, sensor, etc.).
Changing the Unit of Measurement
On the graph pages, you can change the unit of measurement (e.g., from Liters to m³) using the dropdown menu at the top right.
Overconsumption Analysis
Overconsumption analysis visualizes the proportion of consumption linked to alert events. It displays a pie chart for overall distribution and a stacked area chart for temporal trends. Accessible from the main dashboard, metrics by site, or sensor details.