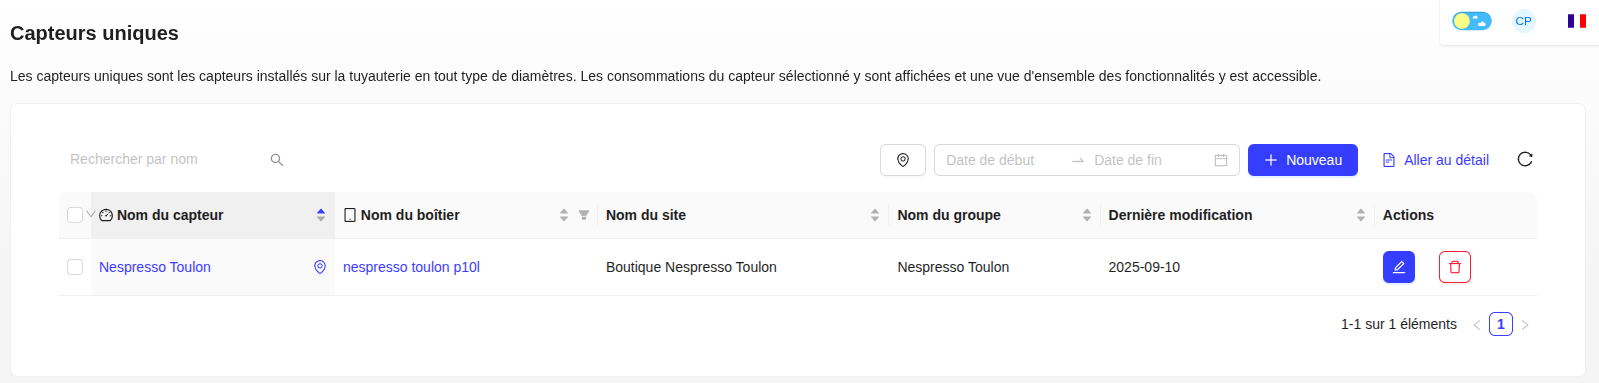
Unique Sensors
Unique sensors are the sensors installed on the piping. This page displays the consumption of the selected sensor and provides access to a set of features.
Create a Unique Sensor
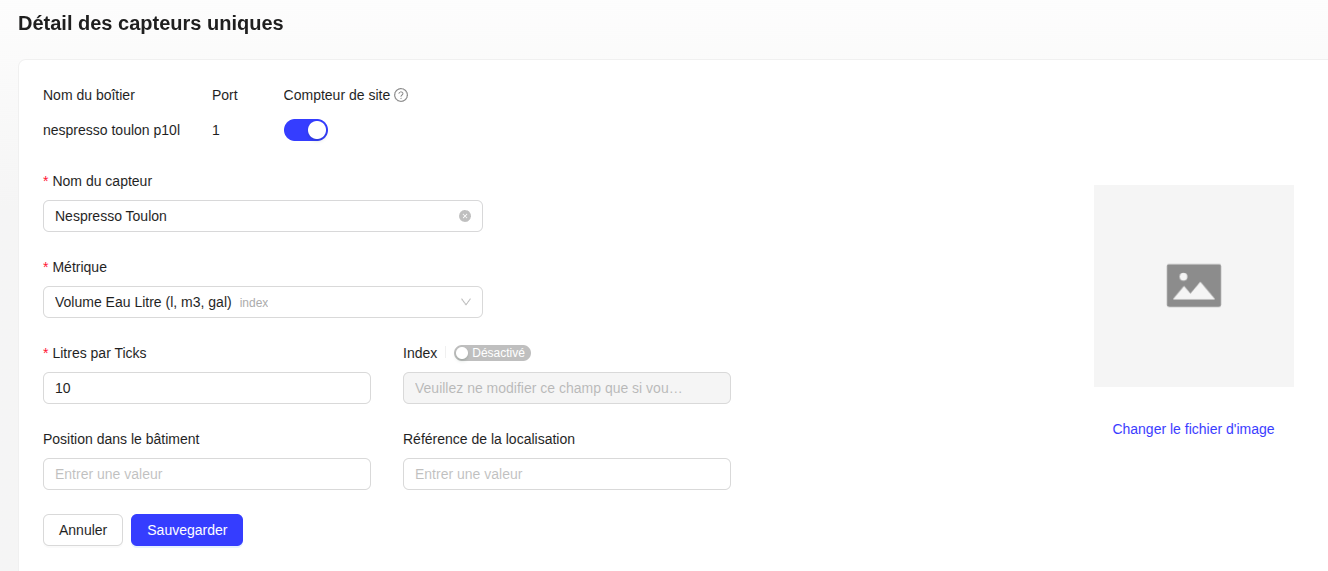
To create a sensor, you just need to fill in the fields: sensor name, its associated metric, the number of ticks per liter & the index, the position in the building & the location reference, then save.
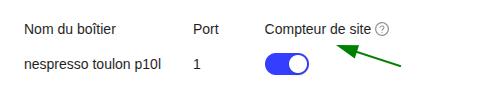
You can activate the site meter feature to use this sensor to measure the total consumption of the entire site. When several sensors on the same site have this feature activated: the sum of the total consumption of all sensors corresponds to the site's consumption.
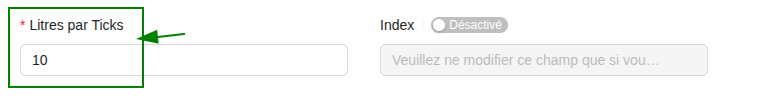
⚠️ The Liters per tick field is a technical parameter. Do not modify it if you are not the creator of the sensor, as this could alter your consumption data.
Previous Period
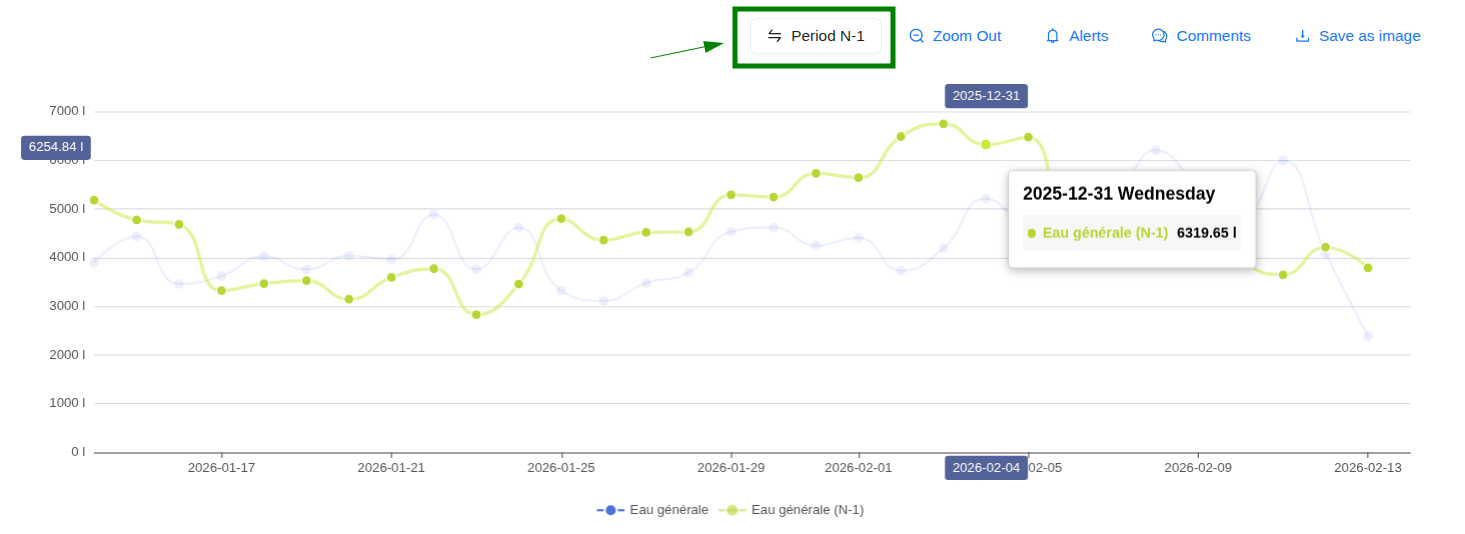
Compare your current consumption with that of the previous period in one click. Enable the "Previous Period" button to overlay your histories and identify your consumption variations.
Sub-tabs
From the detailed view of a sensor, several sub-tabs are available.
Graph
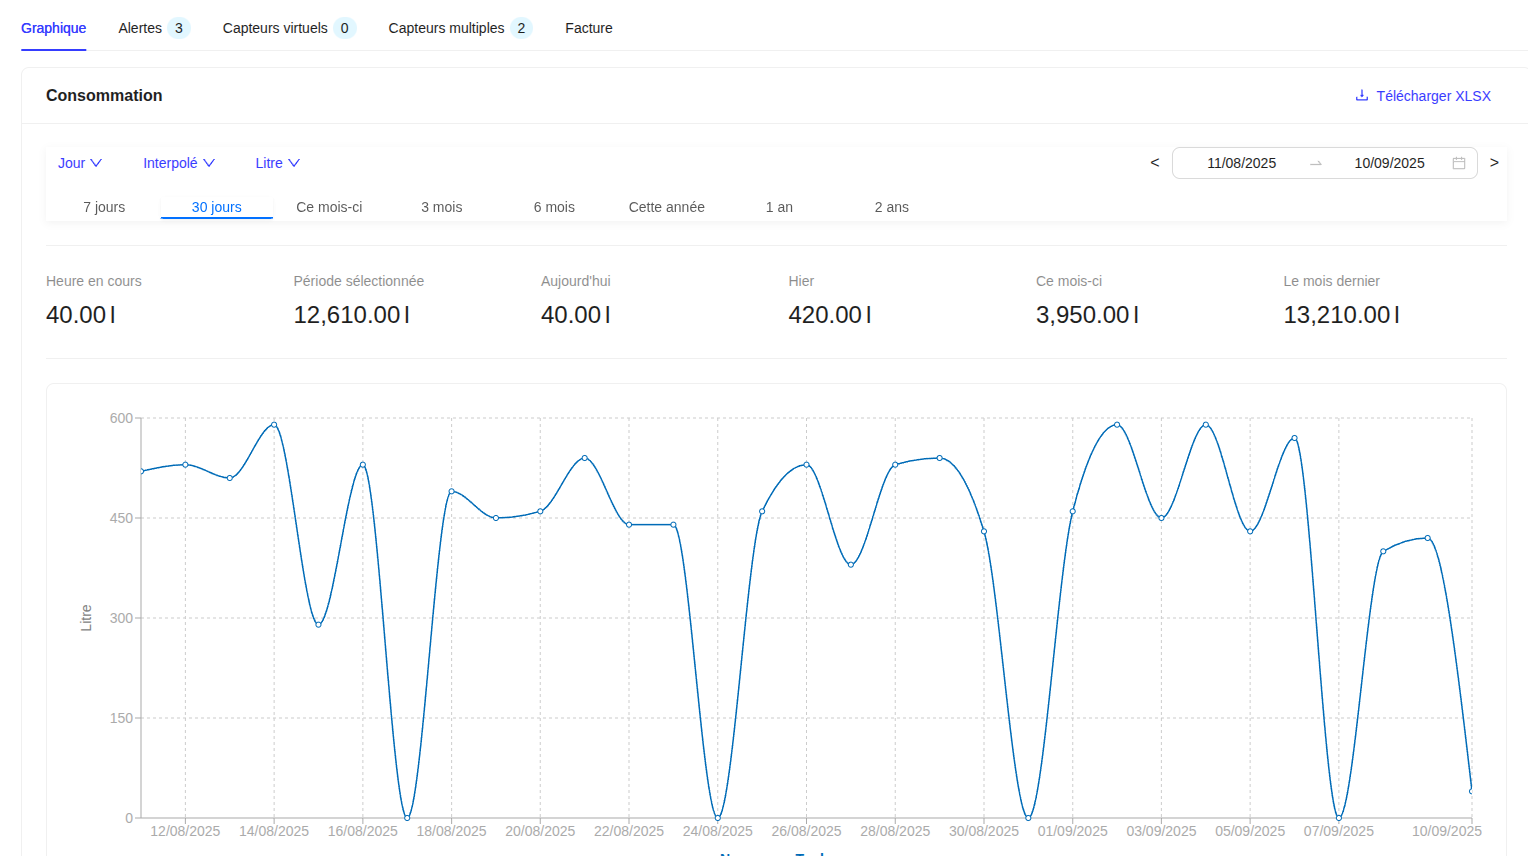
This tab displays consumption in daily data over a rolling month. You can select other periods (3 months, 6 months, 1 year, etc.), display hourly consumption, or compare it with the previous year.
Alerts
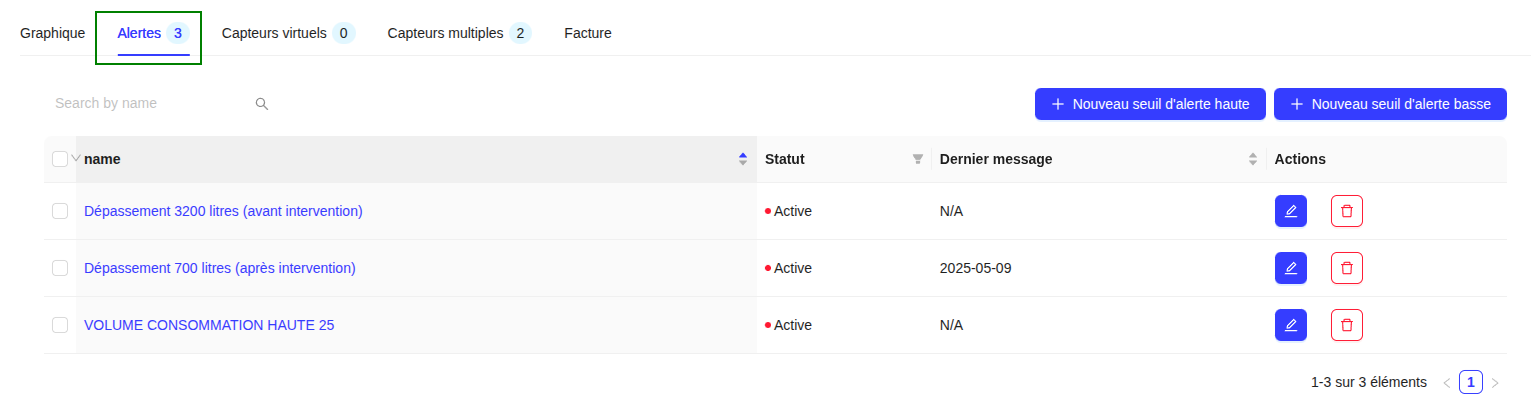
View the list of alerts associated with the sensor and create new high threshold or low threshold alerts.
Virtual and Multiple Sensors
View the list of virtual (sum) and multiple (comparison) sensors associated with this unique sensor.
Invoice
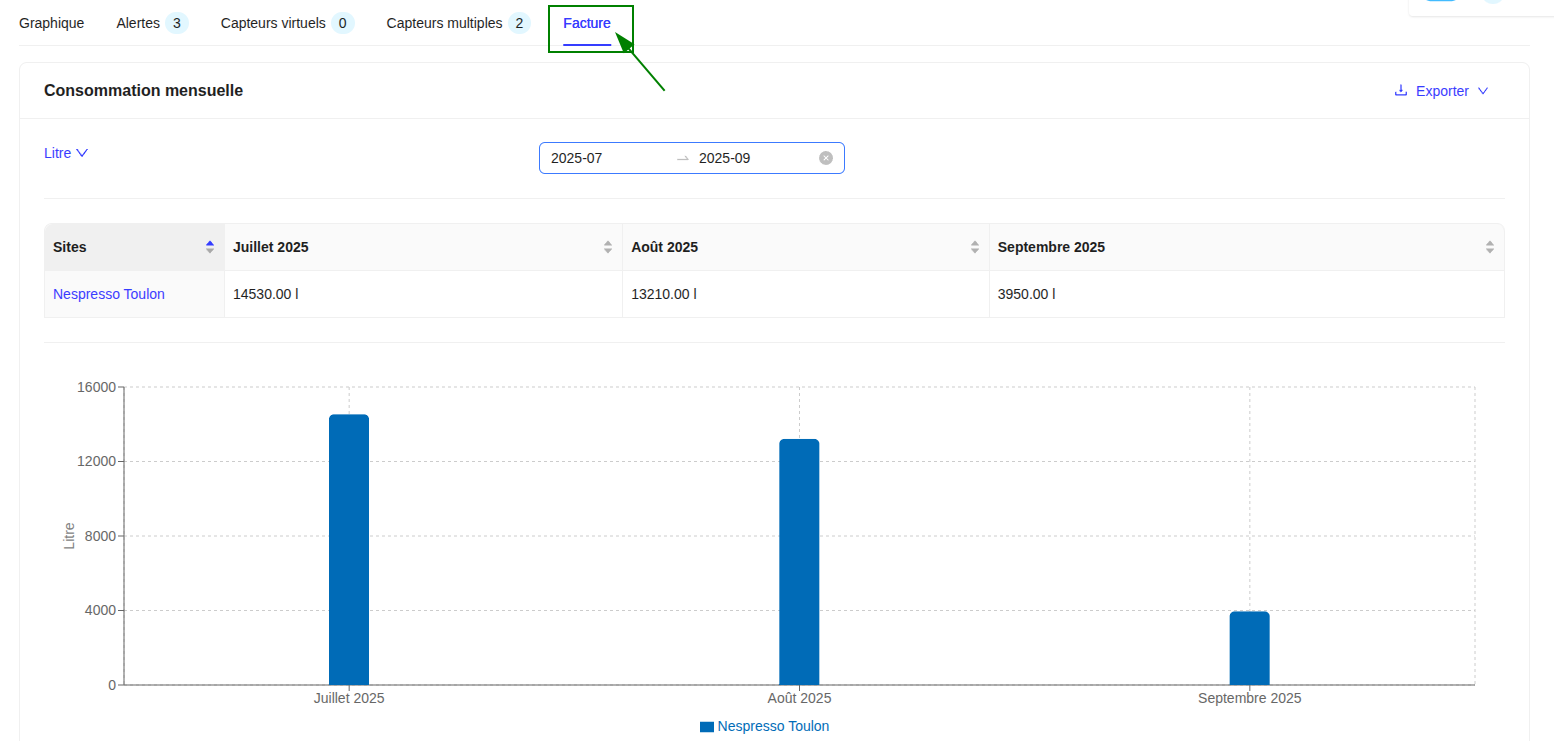
This tab presents the monthly consumption of the sensor, which is useful for re-invoicing and comparison with your water bill. You can export the data in CSV, JSON, or XLSX.